How to Read Google Business Statistics
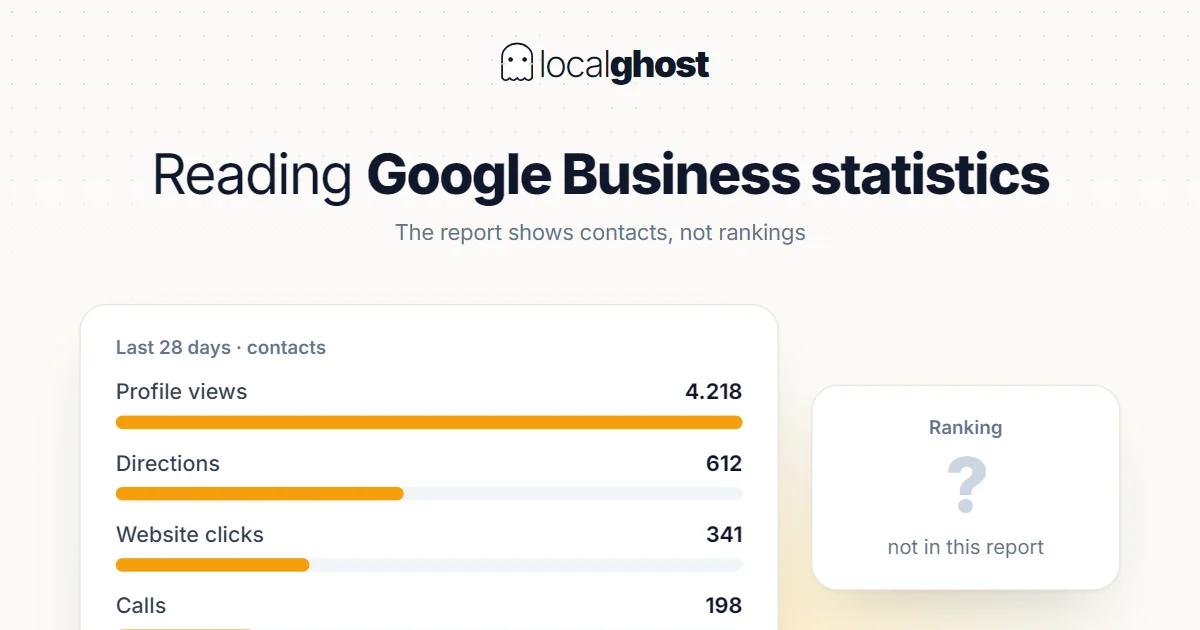
The profile report measures contacts that happened, not your ranking. Confusing the two is the most common misreading.
In this article
Summarize with AI
The profile report is the only first-party data you have: numbers Google measures itself, not estimates. That makes it valuable. It also makes it easy to misread, because the numbers look intuitive and most people treat the first metric they see as the measure of success.
This guide covers what each metric tells you, which one misleads on its own, and what is not in the report at all.
What the report shows and what it does not
The report shows two things: how people found your profile, and what they did after finding it.
What it does not show is the thing most people look for: ranking. There is no answer to "what position am I" in the profile report. A fall in impressions looks like it implies a ranking drop, but other causes produce the same result — season, competitor activity, the volume of the query itself.
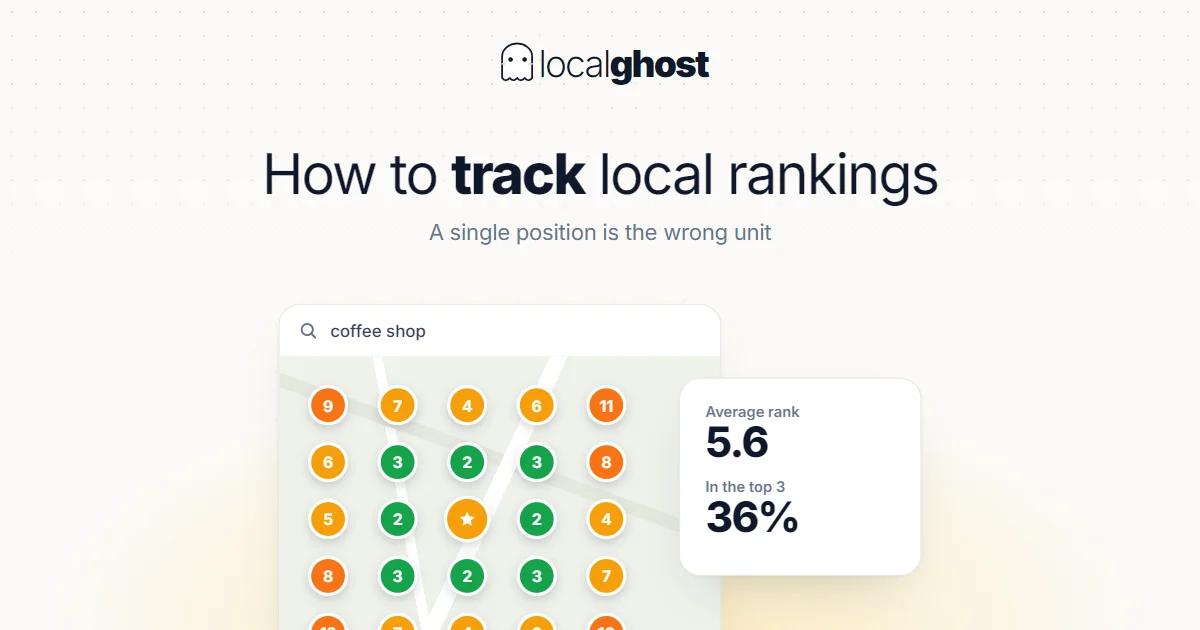
Ranking is a separate measurement job with a different method: how to track rankings. Using the report as a ranking tool is the most common misreading.
The second thing it does not show also matters: your competitors' numbers. The report measures your own profile and gives no comparative table. So the answer to "is this good or bad" is not inside the report; it is in the comparison with your own history. Rather than trusting sector-average figures circulating online, take your own three-month trend as the benchmark.
Two groups of metrics: impressions and actions
Splitting the metrics into two boxes clarifies everything.
Impressions and views. How many times your profile was seen. This is a count of *opportunity*, not of results. Rising is good, but on its own it proves nothing.
Actions. What the people who saw it did: calls, direction requests, website clicks, messages, bookings. These are contacts that happened, which is the work itself.
The right reading holds the two together: impressions against actions. If impressions rise while actions stay flat, more people are seeing you and not being convinced — the problem is not visibility but what is on the profile. If impressions fall while actions stay flat, irrelevant traffic has gone, which is usually good news.
That is the situation people hit after narrowing a category: impressions fall, calls rise. The reason: how to choose the right category.
How you were found: branded versus unbranded
The report also separates how people found you: those searching your business name directly, and those searching a service or category and reaching you.
That distinction is the most informative part of the whole report, because the two measure entirely different things:
- Branded searches are people who already know you. Growth is nice but it does not show new customer acquisition; it usually reflects offline recognition — signage, business cards, previous customers.
- Unbranded (discovery) searches are people who do not know you. This is where local SEO work actually shows up.
Which is why looking at the total and concluding "we are growing" is risky: the total can rise on branded searches alone. What you want to measure is the trend on the unbranded side.
The same logic applies to the search-queries report: the list is usually full of variations of your business name. The useful reading is to set the brand queries aside mentally and look at the remaining service queries — which service terms you are found for tells you whether your category and service naming are right.
What the platform and device split tells you
The report also shows whether contacts came from Search or Maps, and the desktop and mobile split. This is not a target in itself, but it diagnoses two things.
If it is Maps-heavy, most demand carries "looking for somewhere nearby" intent. Direction requests, address accuracy and the precision of the map pin come to the front.
If it is Search-heavy, people are searching either your name or a service term. In that case service naming and the description do more work.
The mobile share is dominant for almost every local business; rather than reading that as a finding, take it as a constraint. Which means the phone number, directions and booking link working in one tap is not a preference but a requirement. For businesses that get website clicks, the mobile version of the site directly determines the action counts in this report.
If the numbers are very low, check these first
If the report looks close to empty, the problem is usually not measurement but setup. In order:
Is verification complete. On an unverified profile most fields do not run and visibility stays limited.
Is the category right. A wrong category means query pools you never enter — so there are no impressions to measure: how to choose the right category.
Are the hours right. The "open now" filter eliminates you at the wrong hour: hours optimization.
Are there reviews. With close to zero reviews, the odds of being chosen next to competitors who have them stay low: increasing Google reviews.
How new is the profile. On a newly opened profile the first weeks do not give a meaningful baseline; comparison needs at least a few weeks of accumulation.
Why the report does not match my phone log
A frequent and fair question. The reasons:
- The report counts only calls started from the profile. A customer who saved your number or read it off your signage does not appear.
- Unanswered calls count too. The call figure is "call started", not "conversation".
- Repeat attempts by the same person can be counted separately.
- Time zone and day-boundary differences produce small deviations.
The practical consequence: use the report as a trend gauge, not as an accounting record. The correct sentence is not "we got 43 calls this month" but "calls have been rising for three months".
History is limited: export regularly
The report has one constraint: historical data does not sit there indefinitely. If you want long-term comparison — particularly comparing the same month last year in a seasonal business — the data has to be exported regularly and kept somewhere.
Neglected in a seasonal business this is a heavy loss: you cannot compare seasons and end up estimating from scratch every year.
Tying changes to measurement
Where the report earns its keep is showing the return on a change you made. But that requires discipline:
- Note the current state before the change. Impressions, calls, directions, website clicks.
- Change one thing. Category, hours, photo coverage or a review routine — not all at once.
- Wait weeks. Profile changes do not register fully within days.
- Compare two periods of equal length. Four weeks against four weeks; because months differ in length, a "last month" comparison introduces skew.
- Account for season. August and September can be different baselines for the same business.
Without that discipline the report only shows fluctuation, and reacting to fluctuation is how people end up changing five things at once and being unable to measure any of them.
Which metric decides, by sector
The same report reads differently by sector, because the channel conversion runs through changes.
Trades where the phone dominates. Taxi, transfer, removals, inspection. Website clicks are close to irrelevant here; the metric to watch is calls. A taxi rank with no website can be doing well with zero website clicks — taxi and airport transfer.
Trades where directions decide. Restaurants, breakfast places, retail. A direction request is the signal closest to purchase — Google Business guide for restaurants.
Trades with few but qualified contacts. In wholesale and B2B the numbers look low and that is normal; one call can be a buyer relationship lasting years. Reading the metric as volume here produces disappointment — wholesale food suppliers.
Trades where booking is the channel. In salons and clinics, clicks on the booking link can be more informative than calls — local SEO for hair salons.
Frequently asked questions
Can I see my ranking in the profile report? No. The report measures impressions and actions; it carries no position data. Ranking is a separate measurement job.
My impressions fell. Did my ranking drop? Not necessarily. Season, changes in query volume, competitor activity and a narrowed category all produce the same result. Check the action metrics first: if impressions fell while calls held, irrelevant traffic probably left.
The call count differs from my phone log. Why? The report counts only calls started from the profile and includes unanswered ones. Read it as a trend gauge, not an accounting record.
Which metric should I watch? The channel conversion runs through in your sector. Calls if the phone dominates, direction requests if visits dominate, booking clicks if appointments dominate.
The query list is full of my business name. Is that normal? Normal. Branded queries dominate the list. The useful reading is to set them aside and look at the remaining service queries.
Why should I export the data? History does not sit there indefinitely. If you want seasonal comparison, regular export is the only way.
Written by
Yunus Akan
Related tools: Profile analysis · Grid rank tracking · Photo GPS tagging · All local SEO tools